Expense Fraud Detection System Screenshots.
Overview
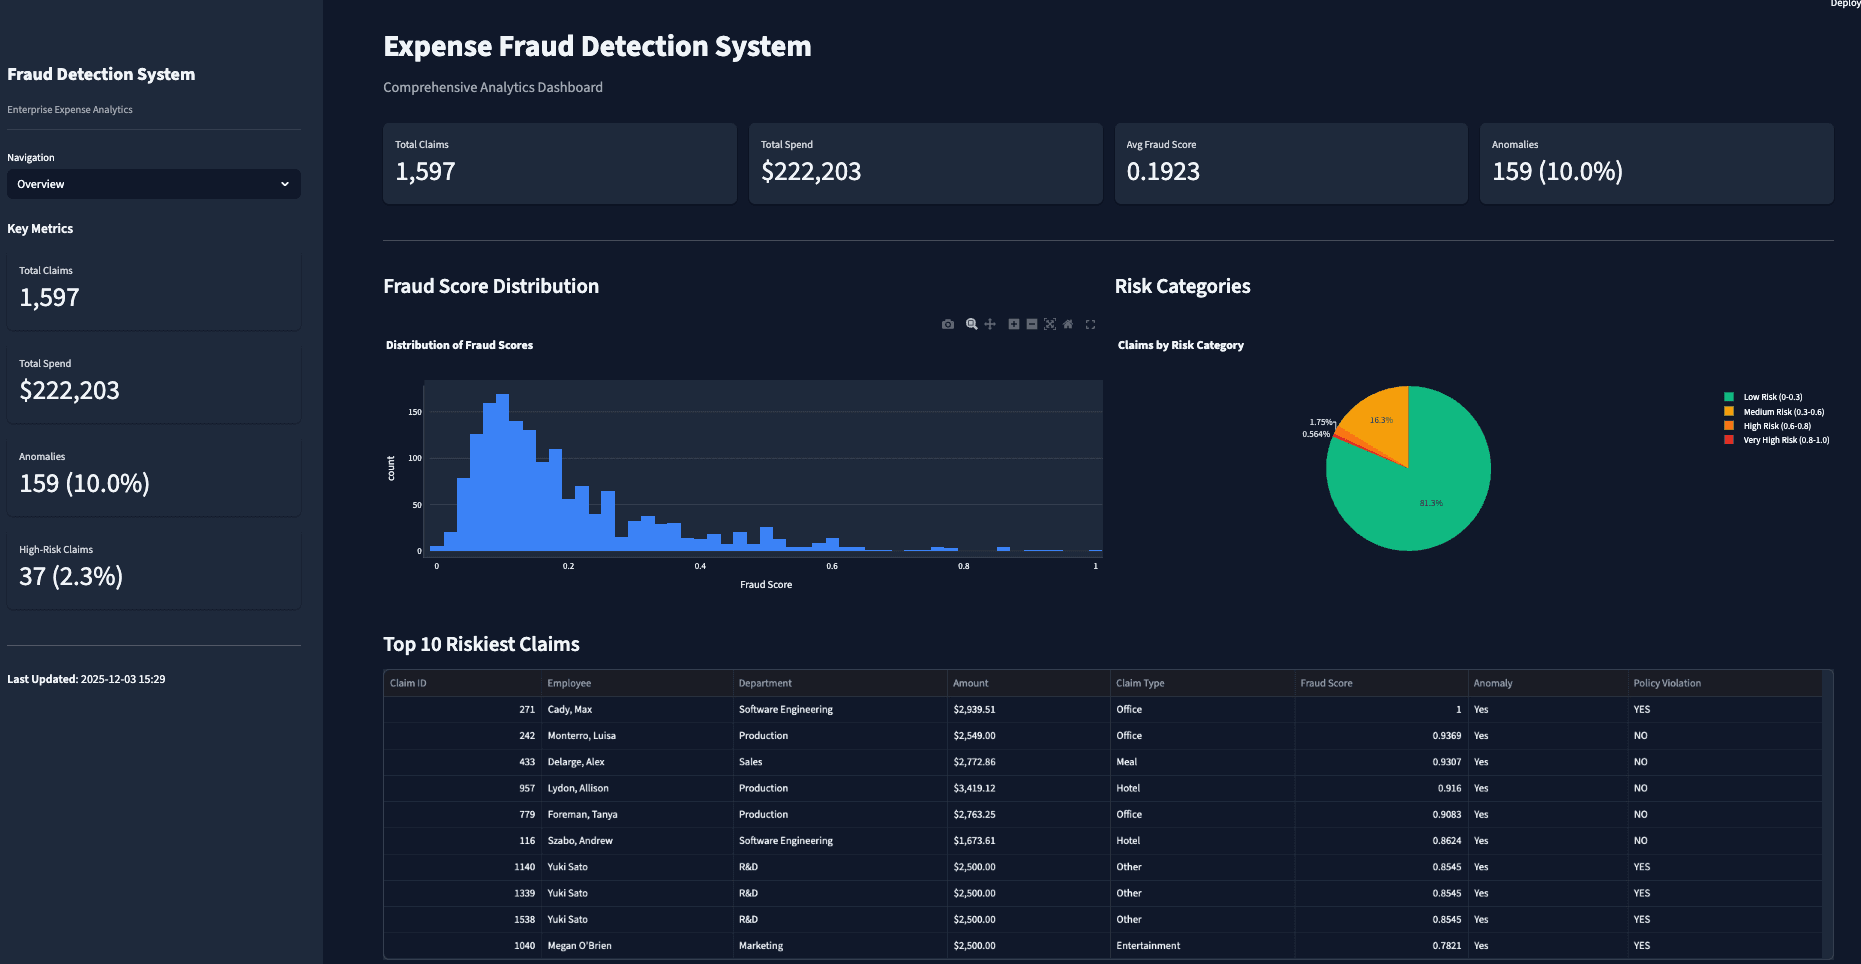
End-to-end enterprise fraud detection system with ETL-to-dashboard pipeline, 7-table normalized schema, 35 engineered features, and Isolation Forest scoring 1,597 claims across 467 employees.
What I built.
- 01Normalized data model for expense intelligence
- 02Isolation Forest model for outlier detection
- 03Feature engineering across spending behavior dimensions
- 04Interactive review dashboard for investigation
Project details
In depth.
End-to-end expense fraud detection system that processes corporate expense claims, scores fraud risk using machine learning (Isolation Forest), and provides an interactive analytics dashboard.
Overview
This system:
- Ingests expense data from multiple sources (HR, credit card, expense logs)
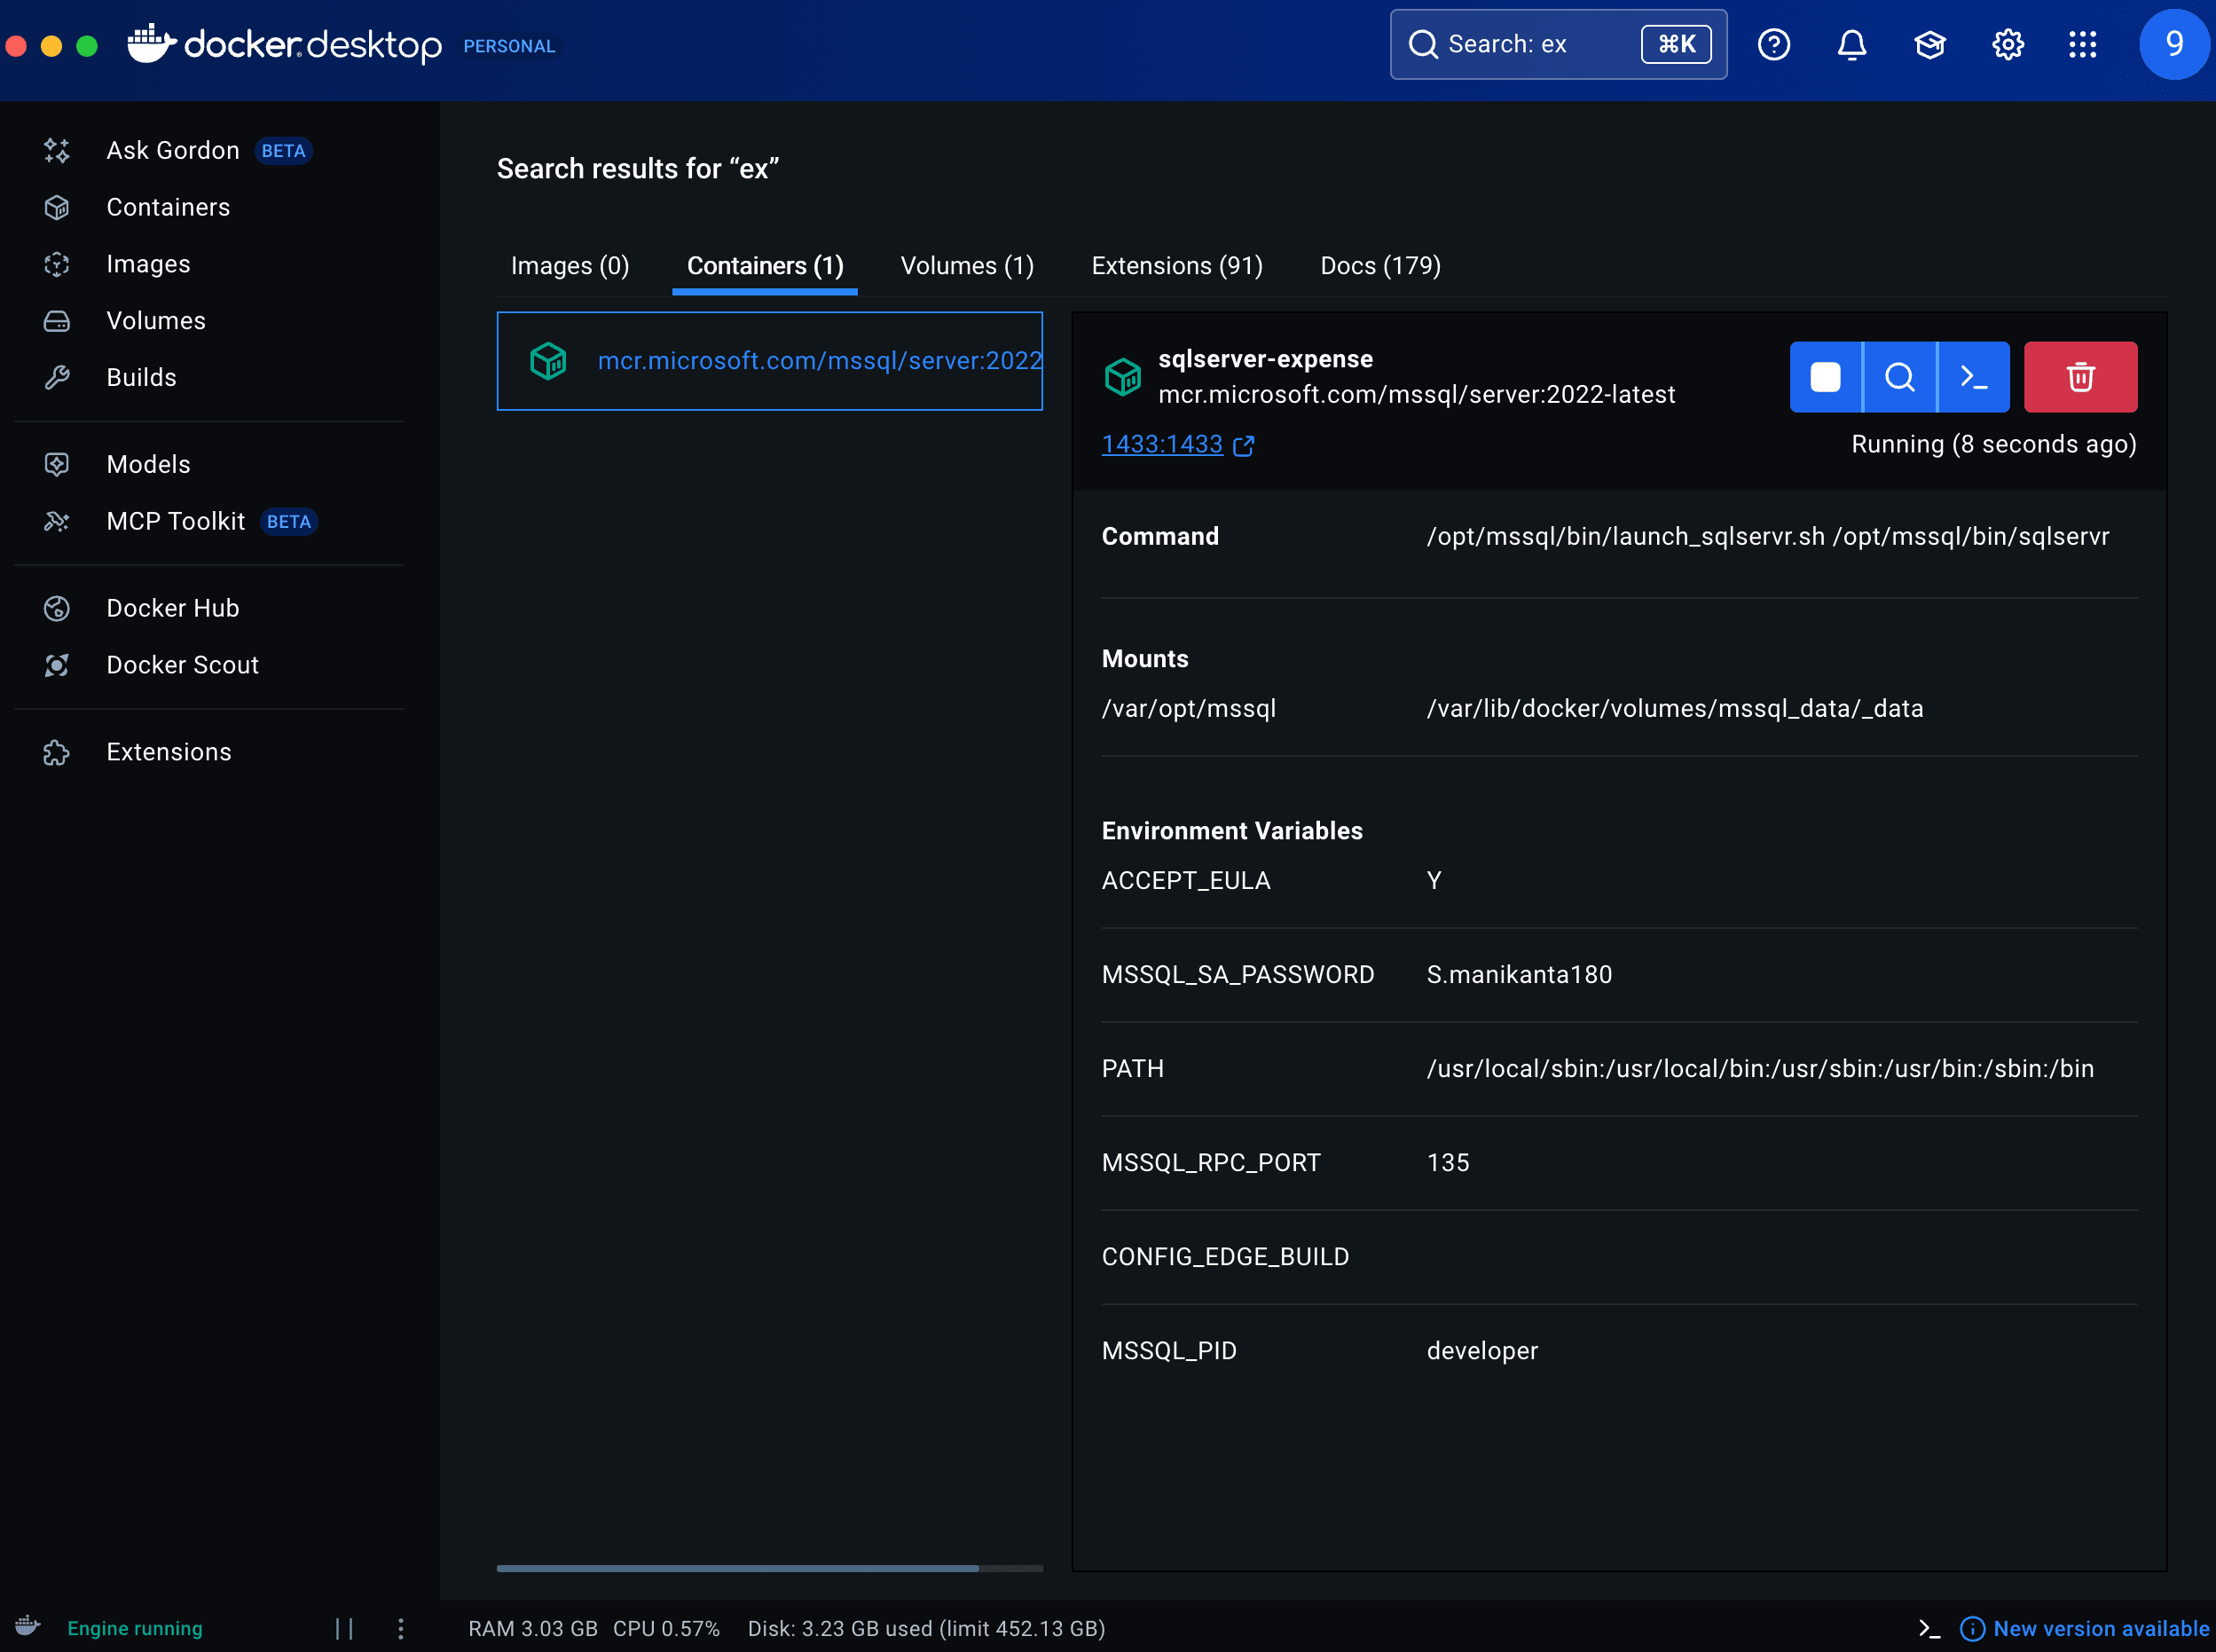
- Cleans & loads data into Microsoft SQL Server via ETL pipelines
- Engineers 35 features and trains an Isolation Forest anomaly detection model
- Scores every claim (0–1 fraud score) and flags anomalies
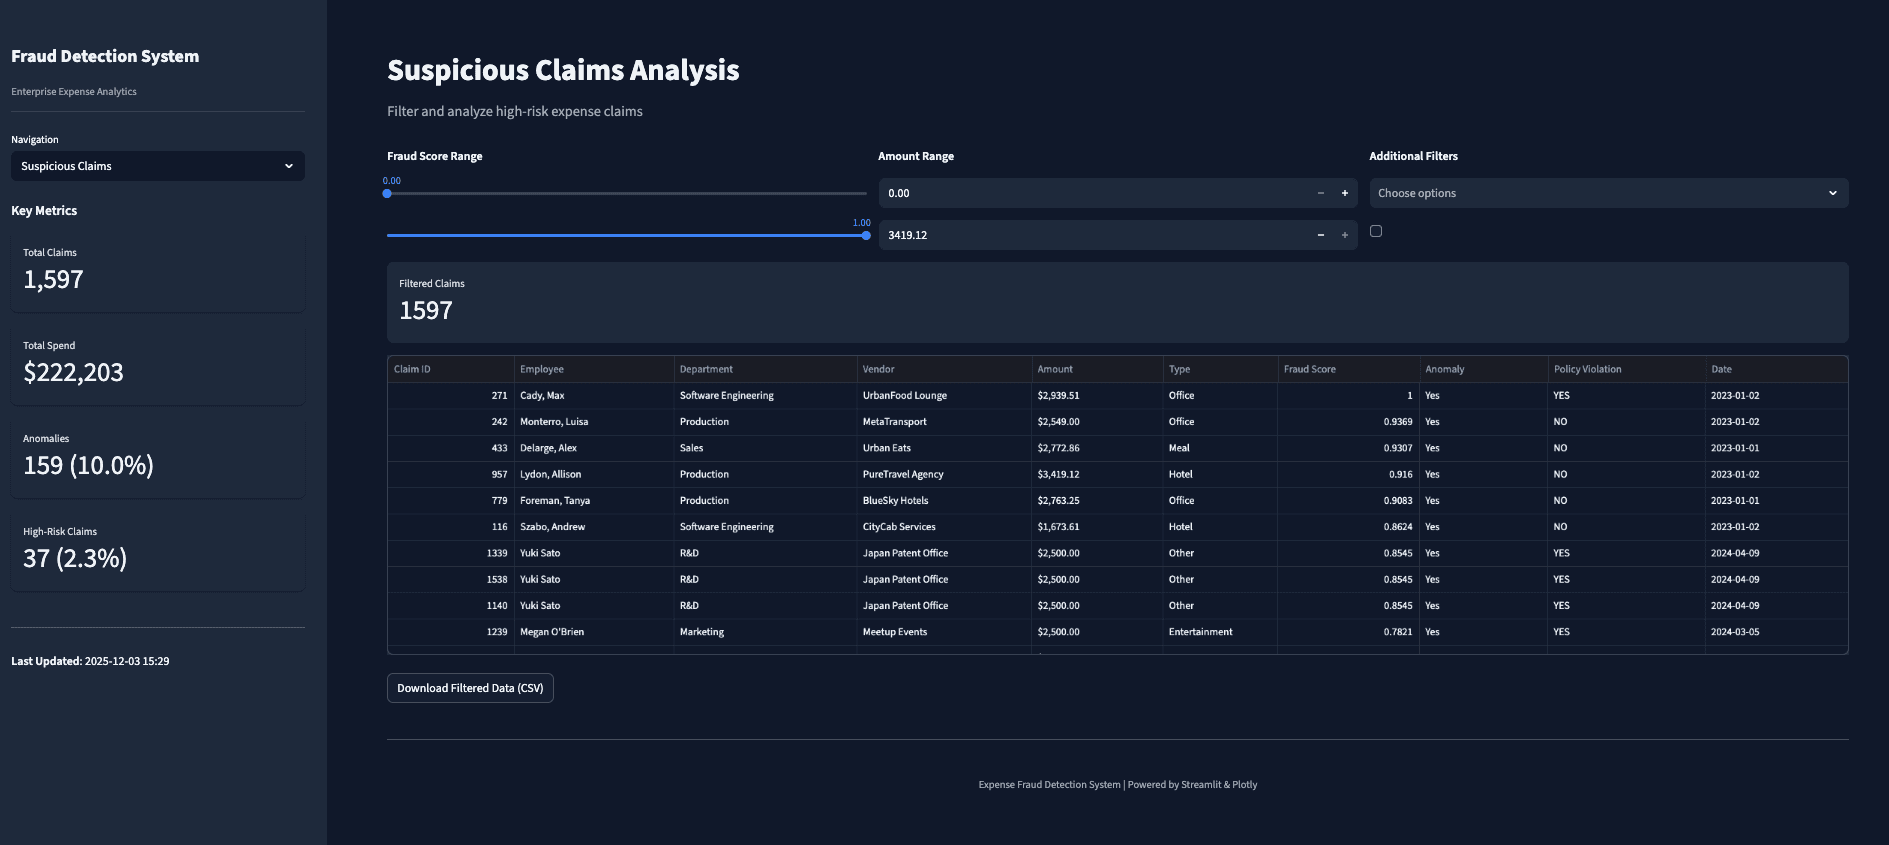
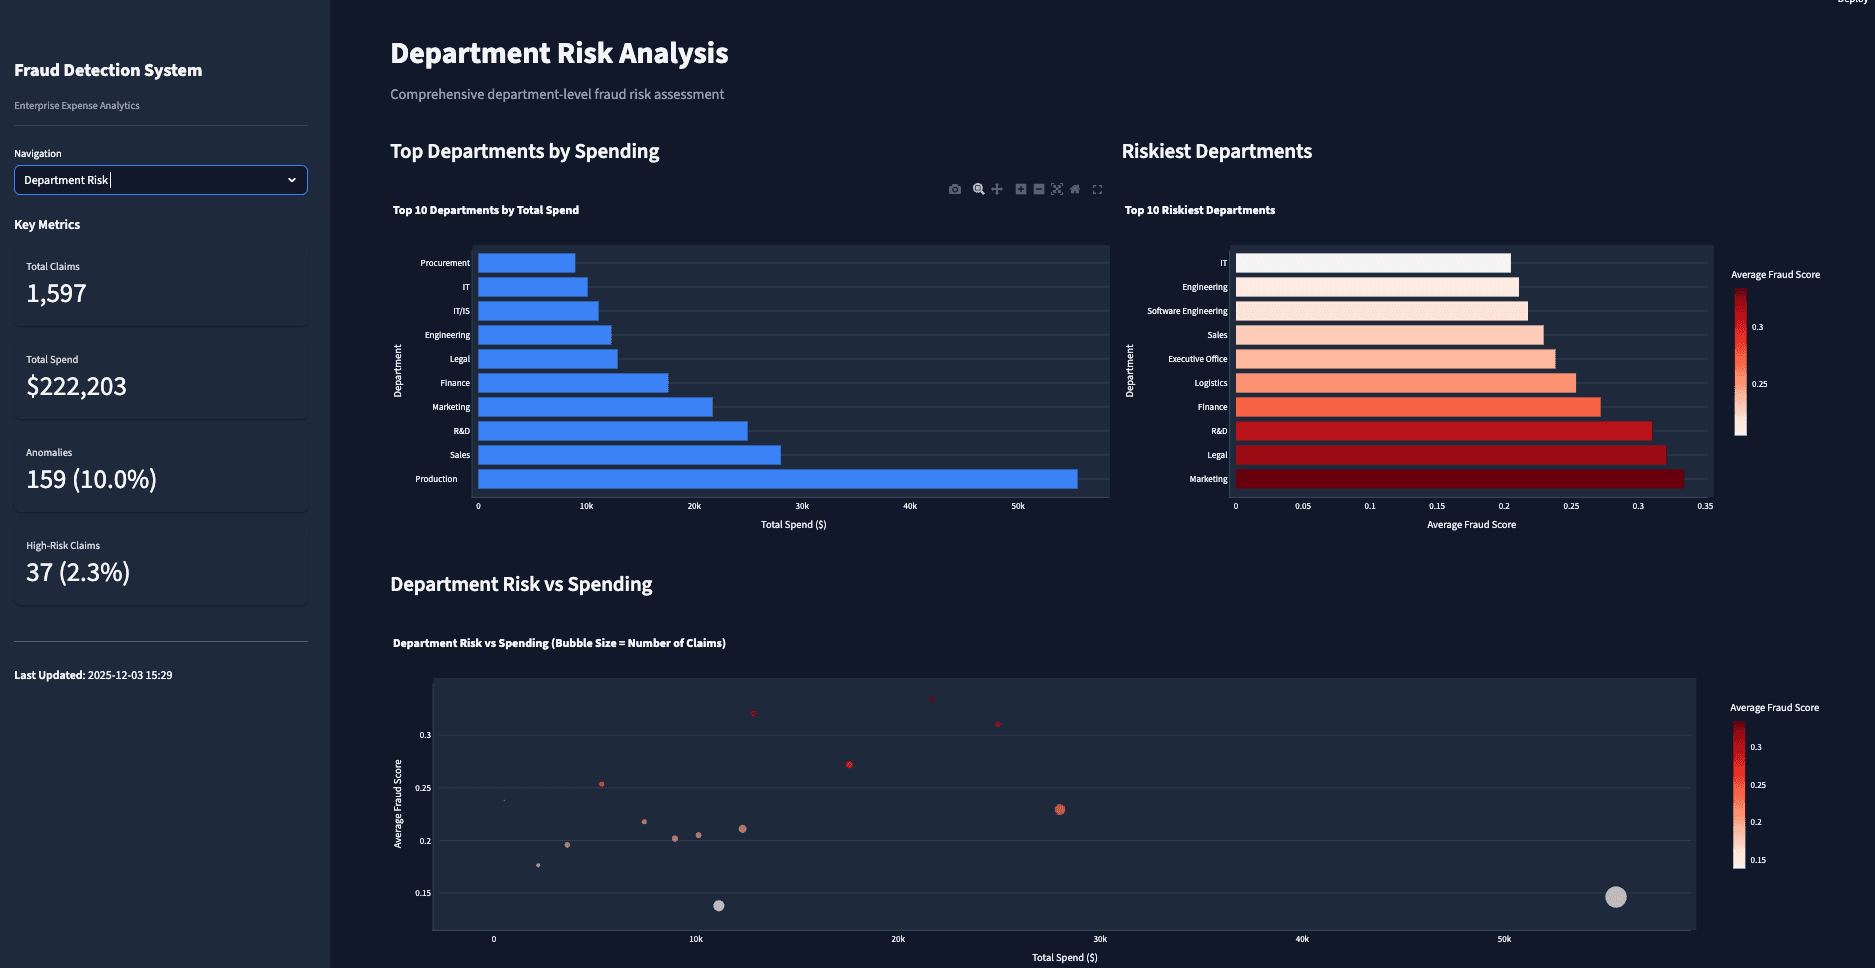
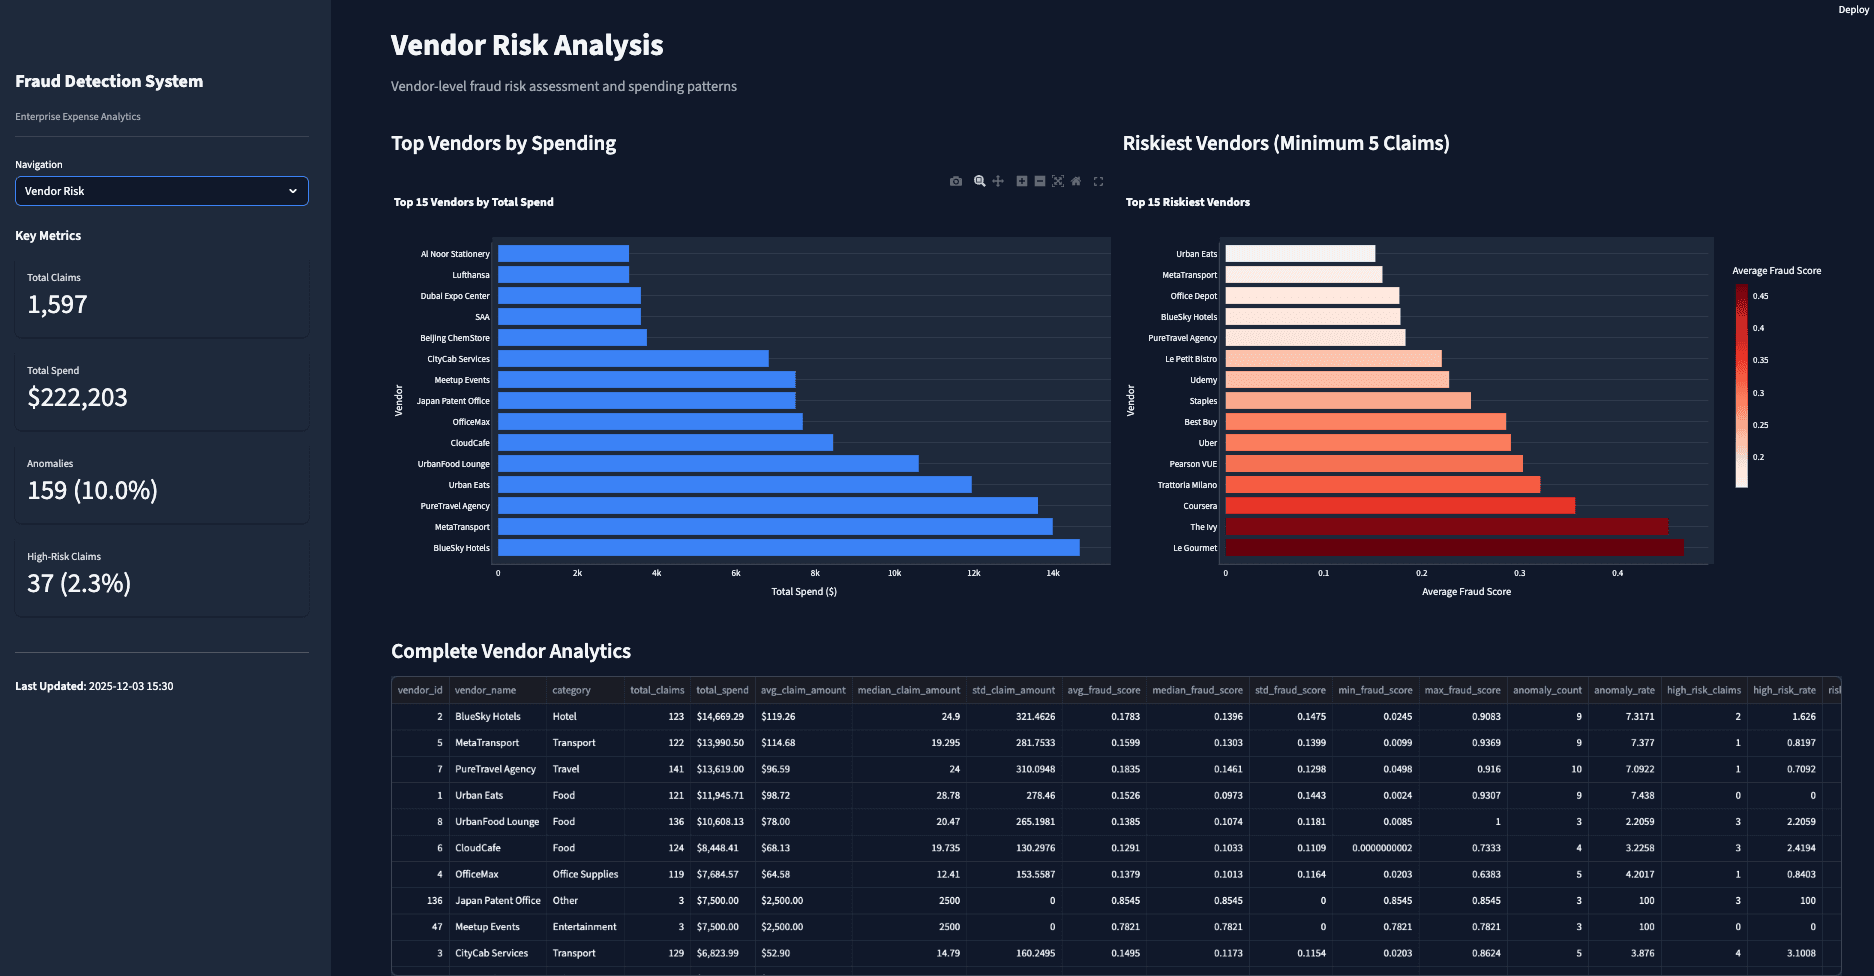
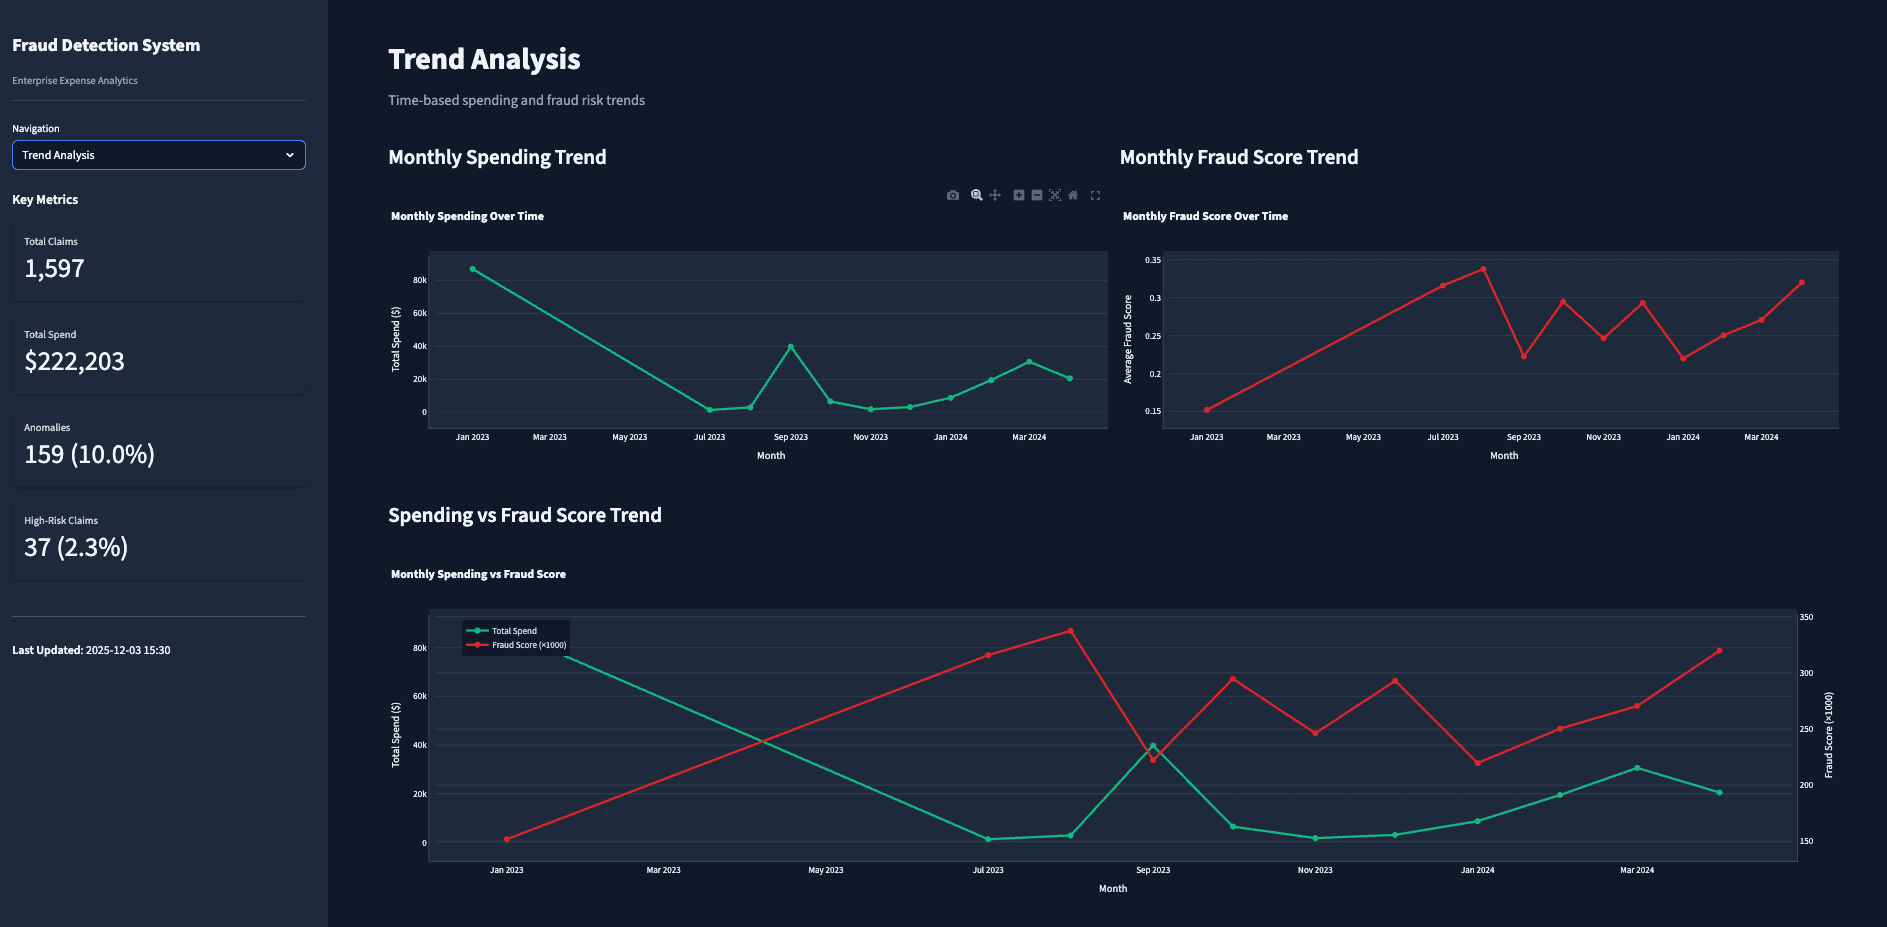
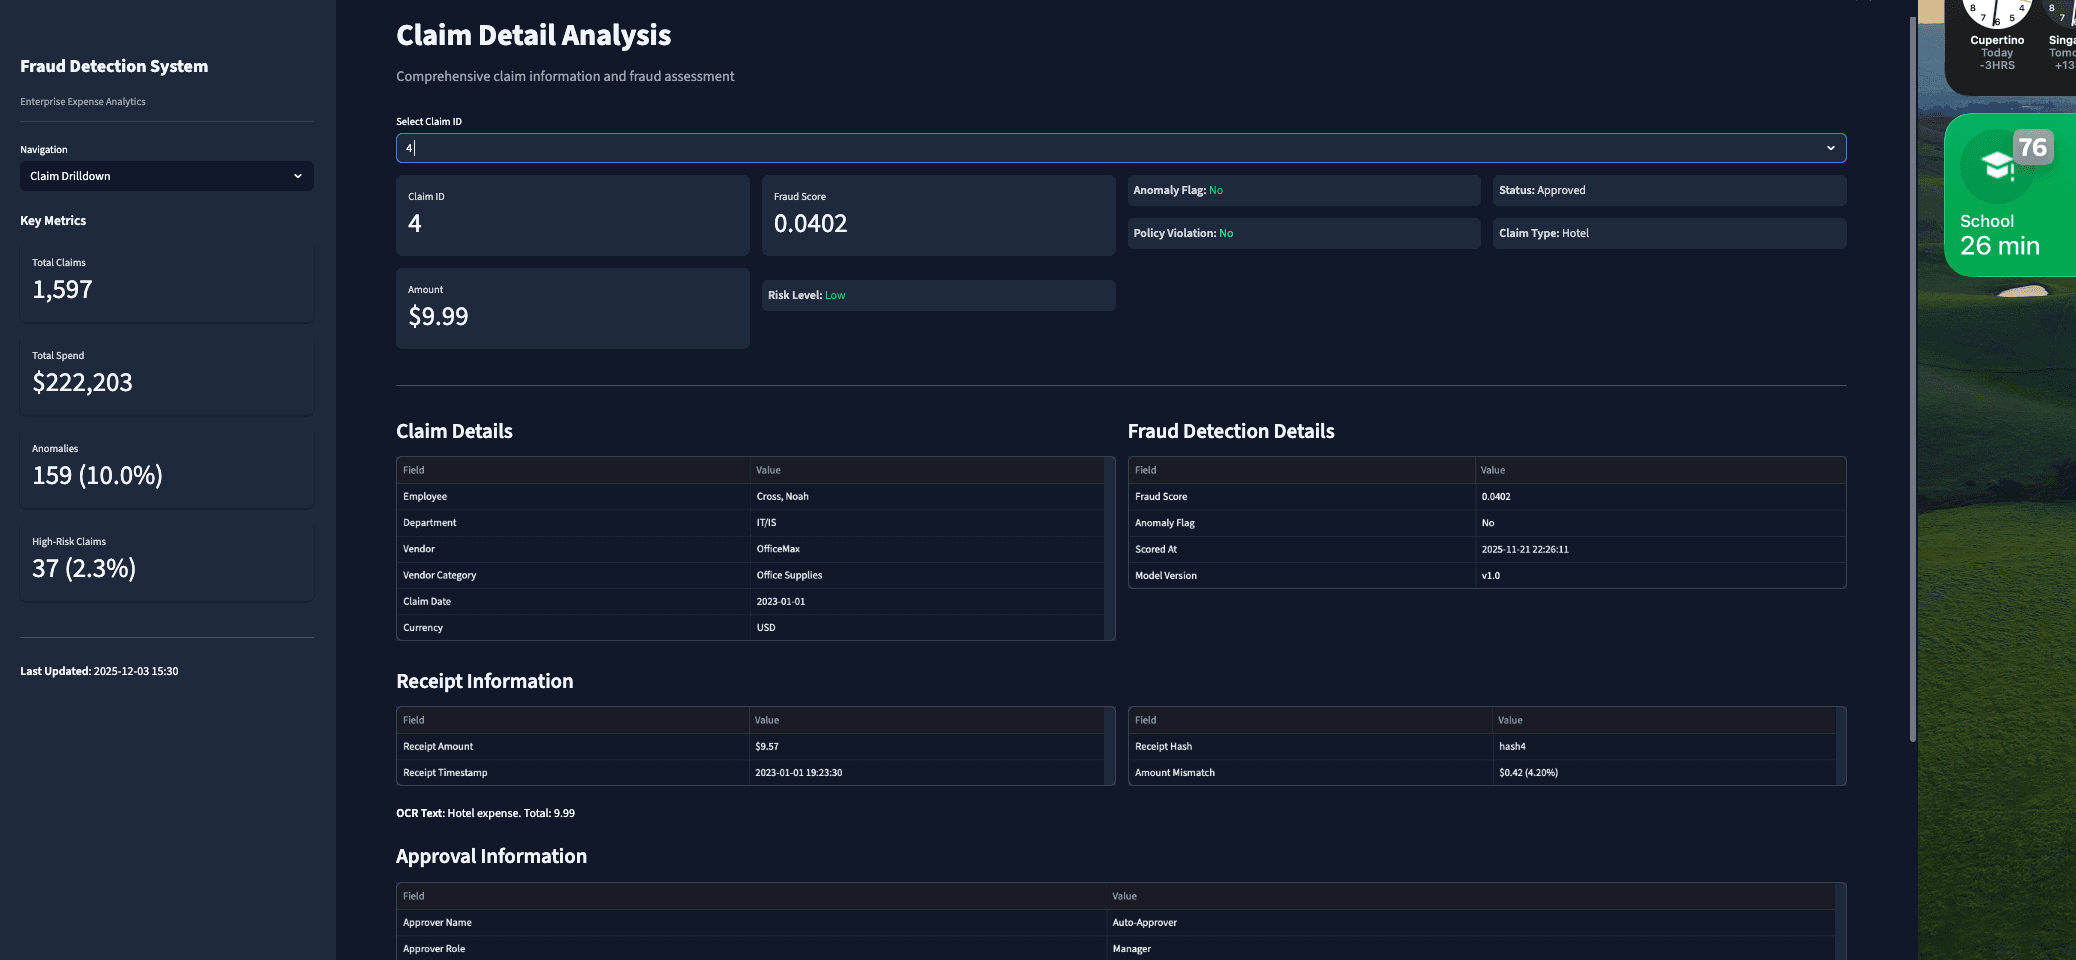
- Surfaces results in a Streamlit dashboard (overview, filters, department/vendor/trend analysis, claim drill-down)
Key metrics
| Metric | Value |
|---|---|
| Total claims | 1,597 |
| Employees | 467 |
| Vendors | 187 |
| Departments | 15 |
| Anomalies detected | 159 (9.96%) |
| High-risk claims | 37 (2.32%) |
Tech stack
| Layer | Technologies |
|---|---|
| Database | Microsoft SQL Server (Docker), SQLAlchemy |
| ETL & data | Python, Pandas, NumPy |
| Machine learning | Scikit-learn (Isolation Forest), 35 engineered features |
| Dashboard | Streamlit, Plotly |
| Visualization | Matplotlib, Seaborn |
Features
- Automated fraud detection – Every claim scored by the ML model
- 35 engineered features – Claim, receipt, employee, vendor, temporal, and interaction features
- Isolation Forest – Unsupervised anomaly detection; no labeled fraud data required
- Validation – Higher scores for policy violations (~131%) and high amounts (~227%)
- Interactive dashboard – Overview, suspicious claims, department/vendor risk, trends, claim drill-down
- Export – Download filtered suspicious claims as CSV
Fraud score bands
| Score | Risk level | Action |
|---|---|---|
| 0.0 – 0.3 | Low | Normal processing |
| 0.3 – 0.6 | Medium | Optional review |
| 0.6 – 0.8 | High | Investigate |
| 0.8 – 1.0 | Very high | Likely fraud |
Project structure
├── data/
│   ├── raw/              # Original datasets
│   └── cleaned/          # Cleaned datasets
├── etl/                  # Cleaning and loading pipelines
├── ml/                   # Feature engineering, training, scoring, model analysis
├── report/               # Analytics CSVs and charts
└── dashboard/
    └── app.py            # Streamlit app
Tech specs
Under the hood.
- Python
- SQL Server
- Scikit-Learn
- SQLAlchemy
- Streamlit
- Plotly
- Docker
Combines ML rigor with operations readiness, making model output useful for real teams.